A deployment finishes. Your API still returns successful responses, but requests are slower. The application runs on ECS Fargate and calls PostgreSQL on RDS. Is the new release waiting on the database, exhausting its connection pool, or spending longer inside the application?
CloudWatch Omni can help assemble the evidence. It cannot make missing instrumentation appear, or turn a plausible explanation into a proven cause. The useful experiment is to introduce one known regression in staging, ask the system to investigate, and independently check its answer.
What AWS documents today
AWS announced CloudWatch Omni general availability on 23 September 2026, in US East (N. Virginia), US West (Oregon) and Europe (Ireland). It is an observability experience for applications and AI agents built on CloudWatch and OpenTelemetry. The staging design below chooses eu-west-1. AWS GA announcement.
Omni separates an identity domain, a working space, and a CloudWatch Dataset. A space belongs to one account and Region. It discovers services and dependencies, supports telemetry queries, and provides an assistant that can generate SQL or PromQL. Cross-account or cross-Region visibility requires CloudWatch centralization rules; Omni does not aggregate those sources by itself. CloudWatch Omni concepts.
| Status | What we can say |
|---|---|
| Documented capability | Query logs, traces and metrics; inspect service health and dependency evidence. |
| Proposed architecture | One staging account in Ireland, a Fargate API, a CloudWatch agent sidecar and private RDS PostgreSQL. |
| Hypothesis to test | The new task revision spends additional time in a PostgreSQL call. |
| Evidence still required | Correlated release metadata, a slower database span, a matching database wait and recovery after rollback. |
The assistant uses the telemetry permissions of the person asking. AWS explicitly warns that its answer can be wrong and exposes queries and evidence for review. Treat its findings as leads to verify. Ask the Omni agent.
A feasible staging architecture
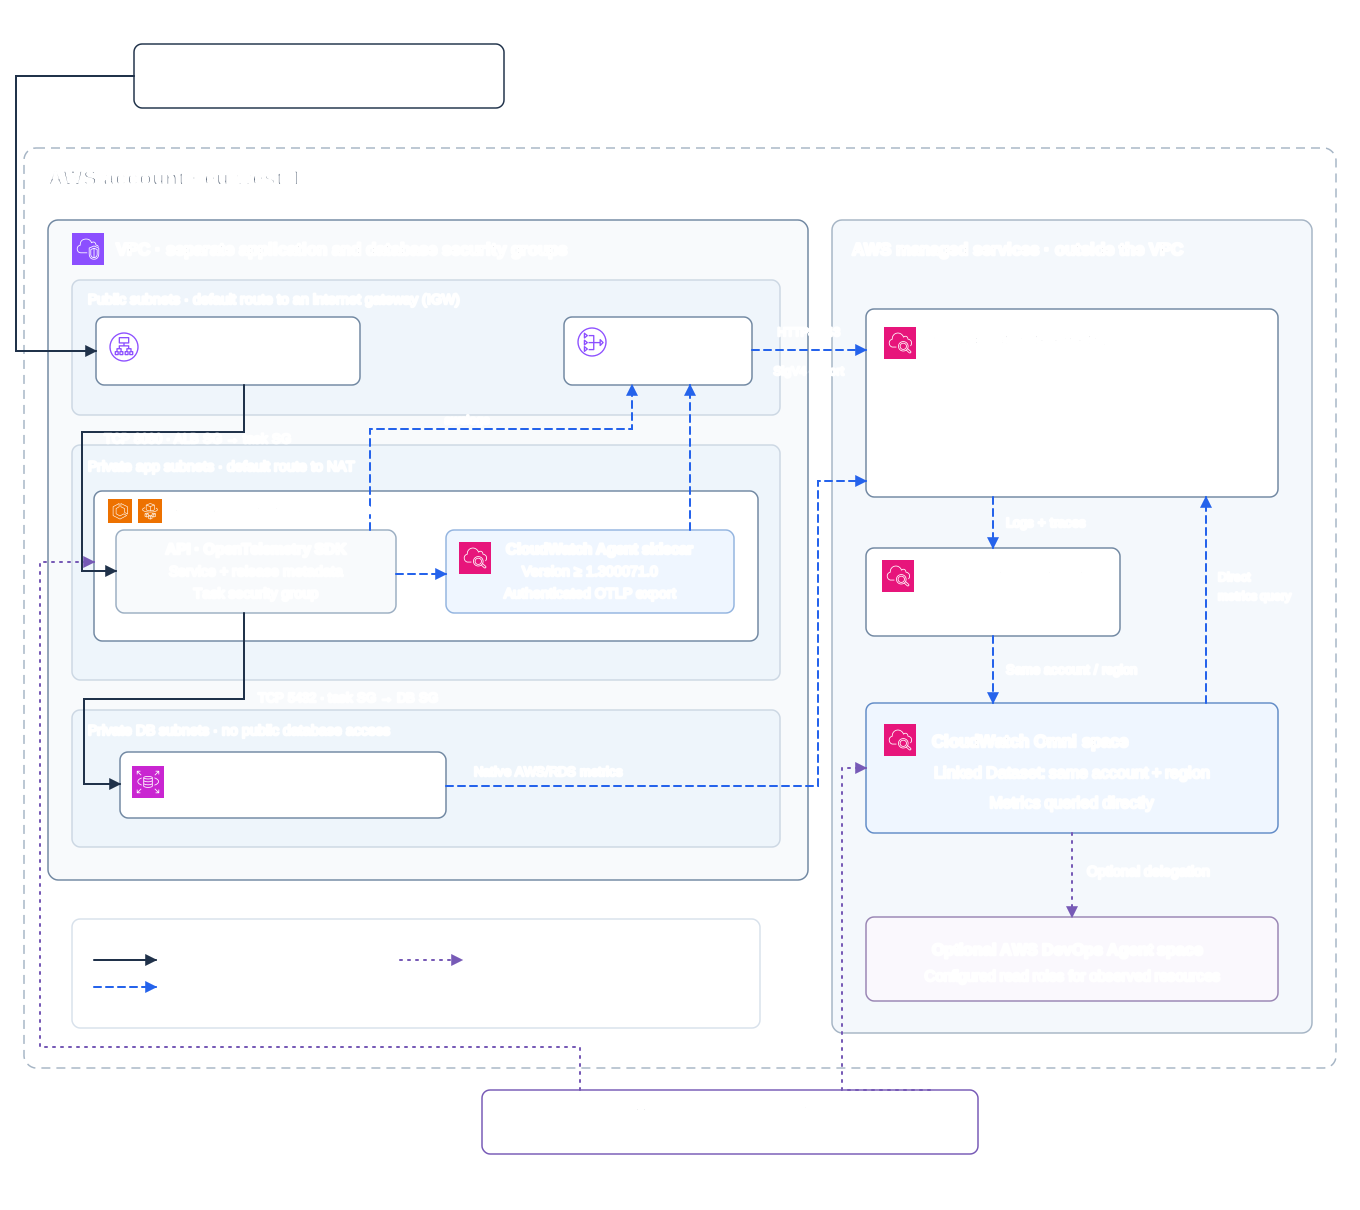
The diagram distinguishes application requests, telemetry exports and human actions. It is a proposal, not a representation of an environment already running.
Use a VPC with two Availability Zones. An ALB routes to the API’s port 8080. Fargate tasks sit in private application subnets; PostgreSQL sits in private database subnets with public access disabled. Permit port 8080 from the ALB security group to the task security group, and TCP 5432 from the task security group to the database security group. Require PostgreSQL TLS with certificate verification. Keep credentials in Secrets Manager and inject them into the API container.
The diagram shows a public HTTPS ALB: this requires an actual ACM certificate and DNS configuration, with ingress restricted to the runner. An alternative lab can use an internal HTTP ALB and a load generator with VPC access; update the editable diagram to reflect that listener and boundary. A single NAT gateway is a lab simplification with an Availability Zone dependency and possible cross-AZ traffic; it is not a high availability production recommendation.
Private tasks use NAT for outbound HTTPS to telemetry endpoints and image dependencies. NAT is the selected path here; replacing it with VPC endpoints requires verifying every dependency, including ECR, S3, logs and Secrets Manager. No incoming OTLP ports need exposing on the task security group. Fargate’s awsvpc networking gives the application and sidecar a shared task network namespace. Fargate networking.
RDS does not run the application collector. Its native service metrics come from AWS; the database client span comes from the instrumented API. Logs from PostgreSQL require a separate RDS log export configuration. Enhanced Monitoring and Database Insights are additional choices, not consequences of installing a sidecar. RDS monitoring tools.
Instrumentation, collection and authenticated export
Use supported OpenTelemetry instrumentation for the HTTP framework and PostgreSQL client. Load it before the application imports those libraries. Trace the incoming server request and the outgoing SQL operation. Propagate context through application calls, and correlate logs with trace_id and span_id when an active span exists.
For Fargate, AWS documents a CloudWatch agent sidecar, version 1.300071.0 or later. Attach CloudWatchAgentServerPolicy to the task role. Make the application depend on the agent with condition START: AWS’s image has no health check, so HEALTHY would block startup. Pin the selected agent image by digest for the experiment. Send application telemetry.
For a Python API, the application container can use:
OTEL_SERVICE_NAME=staging-api
OTEL_RESOURCE_ATTRIBUTES=service.namespace=kloud-lab,service.version=release-a,deployment.environment.name=staging
OTEL_EXPORTER_OTLP_ENDPOINT=http://localhost:4318
OTEL_EXPORTER_OTLP_PROTOCOL=http/protobuf
OTEL_TRACES_EXPORTER=otlp
OTEL_METRICS_EXPORTER=otlp
OTEL_LOGS_EXPORTER=otlp
OTEL_PYTHON_LOGGING_AUTO_INSTRUMENTATION_ENABLED=true
OTEL_TRACES_SAMPLER=always_on
These are application variables. The agent’s basic receiver configuration is {"opentelemetry":{"collect":{"otlp":{}}}}. Local traffic reaches the sidecar; the agent then exports with HTTPS and SigV4, using temporary task-role credentials. Never put an AWS access key into the task definition.
CloudWatch’s OTLP service endpoints accept HTTP, not gRPC. Logs go to https://logs.eu-west-1.amazonaws.com/v1/logs, metrics to https://monitoring.eu-west-1.amazonaws.com/v1/metrics, and traces to https://xray.eu-west-1.amazonaws.com/v1/traces. A self-managed collector needs SigV4 signing on each exporter; logs additionally require log-group and log-stream headers. Metrics and logs also offer bearer authentication, but traces accept SigV4 only. For this AWS workload, use role credentials throughout. OTLP endpoint requirements.
Enable Transaction Search in the receiving account and Region before exporting traces. The Dataset integration forwards logs and traces to the space, under its own execution role, in the same account and Region. Metrics are queried directly from CloudWatch Metrics and do not pass through that Dataset. Restrict forwarding to the lab log groups, and set retention deliberately. Send telemetry to Omni.
Traces alone are insufficient for complete RED views. Install the CloudWatch plugin for OpenTelemetry and configure a metrics exporter: the plugin creates request, error and duration metrics but does not export them itself. With the Python package installed, auto-instrumentation loads its span-metrics instrumentor. Check actual metric arrival; a missing Errors series does not mean zero errors. Application tutorial, AWS Python plugin, Service-view limits.
Release context and IAM boundaries
Keep service.name and service.namespace stable across replicas. Record service.version, the commit SHA, image digest, ECS task-definition revision and deployment time in a structured release event. Put release identifiers on traces and logs, while keeping metric dimensions bounded; an identifier per request would create unnecessary cardinality. This release-event contract is our proposed convention, not an automatic Omni feature.
AWS’s Context Graph documentation still gives deployment.environment as its environment example, while newer ingestion examples use deployment.environment.name. Check the attributes your installed instrumentation actually emits and the grouping Omni applies; add the legacy environment attribute if the selected view requires it. For database spans, check the database namespace and destination identity. A hostname-only span may remain a hostname dependency rather than resolve to the RDS resource. An absent graph edge is not proof that no dependency exists. Context Graph.
Keep the IAM responsibilities separate:
| Role or principal | Responsibility |
|---|---|
| ECS task role | Collector telemetry export; scoped application AWS calls if needed. Shared by containers in this task. |
| ECS execution role | Image pull, awslogs delivery and scoped Secrets Manager access for injected secrets; KMS permission if needed. |
CloudWatchOmniOperatorRole |
Space access and integration configuration. |
CloudWatchOmniDatasetIntegrationExecutionRole |
Forwarding CloudWatch logs and traces into the Dataset. |
| DevOps Agent primary-account role | Read permitted resources and telemetry for investigations. |
| Human deployment role | Create revisions, deploy, rollback and remove lab resources. |
Task and execution roles are distinct in ECS; secret injection is not a reason to give the collector administrator access. ECS task role, Execution role.
Omni setup creates its service roles and requires administrator setup permissions. Its space-use policies do not authorize creating a domain or space, or ingesting telemetry. If using IAM Identity Center, its instance and the Omni domain must share a Region, including through replication where appropriate. An IAM console sign-in path is also documented. Single-account setup, Omni IAM policies.
When an investigation actually starts
Native Omni root-cause investigation requires a linked AWS DevOps Agent Space in the account from which you access Omni. An administrator attaches AIDevOpsAgentFullAccess to CloudWatchOmniOperatorRole, selects the Agent Space’s Region and connects it. The POC keeps both spaces in Ireland for simplicity; the integration documentation does not impose identical Regions. If Omni uses Identity Center, configure matching sign-in for the Agent Space.
A human can ask for an investigation in a thread, enter /investigation new <description of issue>, or choose Investigate on a firing Omni alert. An Omni alert never starts an investigation automatically. Automatic delegation of a root-cause question follows the user’s request. Omni investigation integration.
Omni alerts are separate from existing CloudWatch alarms. DevOps Agent separately supports automatic starts from configured alert integrations or webhooks; that is another integration to configure and test, outside this POC. Omni alerts, DevOps Agent production operations.
DevOps Agent investigations are available in its supported Regions, including Ireland. Its Agent Space can investigate resources across Regions and authorized secondary accounts. Its release-readiness review and release-testing feature remains a us-east-1-only preview in the verified regional table; do not assume it is enabled by this Ireland integration. DevOps Agent Regions.
The Agent Space’s resource-access roles define the scope; linking Omni does not grant access to every AWS account. Start with read access to lab telemetry and resources. Native investigation tools do not mutate infrastructure; rollback remains a human deployment action in this experiment. Optional GitHub integration requires account registration followed by connecting selected repositories. DevOps Agent security, GitHub connection.
Storage Region and inference Region are different questions. Omni’s Ireland space stores its data in Ireland, while its AI requests may be processed in the documented EU inference Regions. DevOps Agent has its own geographic routing rules. Redact sensitive log content before export and review those rules before sending production data. Omni cross-Region inference.
A controlled experiment, not a success story
The proposed API exposes /probe and executes a parameterized PostgreSQL statement. In revision A, the configured sleep is zero; revision B changes only INJECT_DB_SLEEP_MS to 250 and its release label. The handler must reject any nonzero injection outside staging; the companion API also validates this at startup.
# Inside the instrumented /probe handler, using a PostgreSQL cursor.
delay_ms = int(os.environ.get("INJECT_DB_SLEEP_MS", "0"))
if delay_ms not in (0, 250):
    raise RuntimeError("Unsupported lab delay")
if delay_ms and os.environ.get("DEPLOYMENT_ENVIRONMENT") != "staging":
    raise RuntimeError("Fault injection requires staging")
cursor.execute("SELECT 1 AS ok, pg_sleep(%s)", (delay_ms / 1000,))
This intentionally creates a database wait; it does not simulate every deployment failure. AWS documents Timeout:PgSleep for RDS PostgreSQL. CPU does not have to spike. RDS PgSleep wait.
Run the phases in order, preserving UTC timestamps and configuration snapshots:
- Baseline. Deploy A with a fixed image digest, task size, replica count and database configuration. Confirm healthy ALB targets, telemetry export, a server span and its SQL child span. Warm up for two minutes, then run ten minutes at five requests per second. Record achieved request rate, failures, latency percentiles, database-span duration, ECS CPU/memory and RDS connections. Stop if the baseline is unstable or the generator drops requests.
- Controlled regression. Register B with the same image and resources, changing only the delay and release label. Wait for the ECS service to stabilize and for A’s tasks to drain before comparing. Repeat the identical load. Keep this bounded to staging; stop on sustained errors or unexpected resource pressure.
- Investigation. Select the deployment window in Omni. Compare A and B traces and release logs. If linked, manually start an investigation: give service, account, Region, release time and symptom. Ask it to separate deployment correlation from causal evidence and list alternative explanations. Without the linked agent, carry out the same comparison manually.
- Validate the cause. Verify that the additional time is inside the PostgreSQL client span. During the load, a DBA uses approved VPC access and PostgreSQL permissions to inspect
pg_stat_activityforPgSleep. With Database Insights enabled, inspect the matching wait. Check connection saturation and task CPU as competing explanations. Missing telemetry is a failed experiment, not a confirmed diagnosis. - Rollback. A human redeploys the complete A task-definition ARN, restoring environment, secret references and release metadata. Wait for stabilization, repeat the load and check whether the SQL duration and latency return toward their baseline range. Record the result, including disagreement with the agent’s hypothesis.
- Cleanup. Stop load generation and delete dedicated ECS, ALB, RDS, NAT, ECR and secret resources through the lab’s infrastructure stack. Decide explicitly whether to retain an RDS snapshot. Remove dedicated alerts, log groups, Dataset forwarding and agent integrations if owned by this lab; respect configured retention and shared resources. Check deletion completion and remaining billable resources.
Database Insights visibility needs its own configuration and permissions; IAM telemetry access does not grant PostgreSQL login or SQL execution. A DBA’s validation path is separate from the agent’s read-only AWS role. Database Insights access.
The hypothesis passes only if the changed release, the slower SQL operation, the database wait and recovery after restoring A agree. If they do not, investigate what the experiment actually shows. Sampling, a mixed deployment window, an incomplete dependency map or a load generator bottleneck can each invalidate the comparison.
Lab: deploy the staging infrastructure
Use a test AWS account in eu-west-1 and synthetic data. The expected result is a reproducible experiment and an evidence bundle; this lab has not been deployed or measured for this article.
- Build. Deploy the two-AZ VPC, ALB, private Fargate API, and private RDS PostgreSQL from the diagram. Restrict security groups, verify TLS, and use a dedicated secret. Public HTTPS needs your own domain and an ACM certificate; otherwise, use an internal ALB and private runner.
- Observe. Instrument the API, add the sidecar and its IAM roles, then link data to the Omni space. Verify the release, logs, and PostgreSQL span for one request before fault injection.
- Compare. Record a baseline, inject pg_sleep(0.25) only in staging, repeat the same workload, and, with DevOps Agent linked and configured, start /investigation manually. Otherwise, compare signals yourself. Validate the cause, restore the baseline task definition with its environment, secrets/configuration, and pinned image digest, then retest.
- Hand in and clean up. Submit IaC, image digests, the adapted draw.io file, and redacted evidence from all three phases. Remove disposable resources and check for retained snapshots, logs, and NAT/EIPs. Check AWS pricing before creating billable resources.
Official sources and verification
All sources above were reviewed on 6 October 2026. The most useful starting points are Omni concepts, application ingestion, OTLP endpoints, Omni investigations, DevOps Agent Regions and the RDS PgSleep wait reference. Recheck availability, IAM policies, instrumentation versions and pricing before implementing the lab.
Cloud, DevOps and AI agents. The Kloud journal.
Back to the journal